Seeing the formula for Degree of Quantitation for the first time created a huge of my interest in how to interpret it. Here, the magnitude of transient steady-state signal and fully relaxed magnitude are introduced to analyze the nuclei population in order to explicate this formula in a reasonable manner.
The magnitude of each transient steady-state signal response as a function of the nutation angle (or flip angle) θ can be given by Equation 1:
Equation 1:Mθ=(Mo(1-e^(-Tr/T1))×sinθ)/(1-e^(-Tr/T1)× cosθ)
By comparing the magnitude of each transient steady-state signal (Mθ) with the fully relaxed magnitude (Mo) of the signal response, the Degree of Quantitation can be obtained and can be expressed as Equation 2:
Equation 2:Q=Mθ/(Mo×sinθ)=(1-e^(-Tr/T1))/(1-e^(-Tr/T1)×cosθ)
According to Equation 2, Q can be quantized into specific data in two dimensions of pulse angle and Tr/T1 value. As shown in Table 1, when the pulse angle is close to 30 degrees and when the Tr/T1 value is 7, the Q value reaches 0.9999; when the pulse angle is close to 90 degrees and when the Tr/T1 value is 9, the Q value reaches 0.9999.
Based on such understanding, it extends discussions on two questions:
• Question 1: How to set up the Tr or D1 value in a qNMR experiment?
Best practice commonly recommends that Tr (or sometimes D1) should be set at not less than 5 times the T1 value; however, in order to achieve an ideal quantitative level, it should be recommended to set the Tr value to be not less than 10 times the T1 value during the quality monitoring process, so as to satisfy the saturation regression pulse sequence. The T1 relaxation time is decided by sample concentration, purity, temperature, and solvent, so it should be determined accurately before the qNMR method development. The accuracy of quantification in a qNMR method depends not only on the Q value of the signal response, but also on the accuracy of the integration method and other parameters. More discussions can be found in the section Quantitative NMR Method Development and Data Processing.
Question 2: Which pulse angle should be adopted for a qNMR experiment?
Should the pulse angle be 30o, 90o, or other angles in a qNMR method? We will address this problem by looking into a single scan experiment, focusing on the relationship between the Ernst angle and response intensity.
In one single NMR scan, the signal-to-noise ratio depends on the received response intensity (Mo×sinθ) of a nucleus and the received nuclei population. It is easy to estimate the received response intensity from 0o to 90o. For example, Mo×sin30° vs Mo×sin90° is 1 to 2.
Referring to the T1 regression curve (see Figure below), the maximum response intensity requires at least Tr/T1 no less than 5. Accordingly, it concluded that the pulse angle and the received nuclei population have positive correlation and the pulse angle of 90o brings the maximum signal-to-noise ratio. As the pulse angle decreases, the signal response strength becomes weaker, i.e., lower signal-to-noise ratio in one pulse sequence. This explains why pulse angles of 0-10 degrees are rarely used in practice. The main reason should be that the size of populations is too small, and the receiver will receive a large number of noise response, resulting in a rather low signal-to-noise ratio.
Consequently, a pulse angle of 90o is recommended to achieve the better response sensitivity and spectral resolution. In practice, to achieve the maximum signal-to-noise ratio in a single scan, a pulse angle of 90o is usually selected for acquisition. But to reduce the need for the D1 time, a pulse angle of 30o is sometimes a commonly used pulse angle, where it is worth noting that the pulse angle of 30o must be well calibrated. Also, the signal-to-noise ratio can be compensated by more scans.
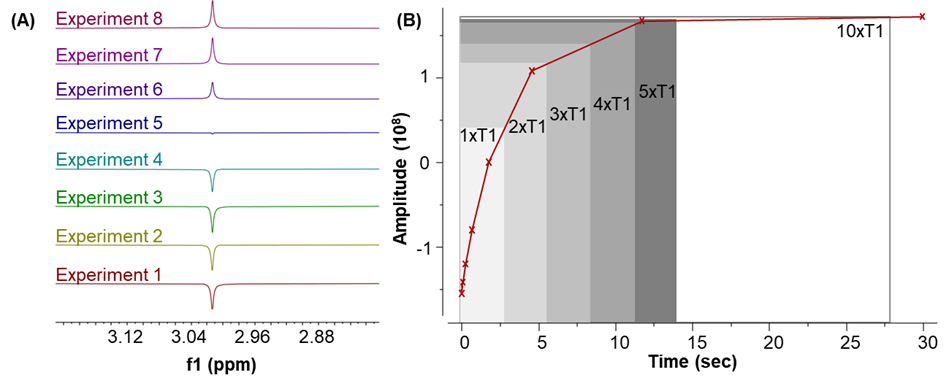
(A) T1 experiment of methyl sulfonyl methane (MSM) using inversion recovery pulse sequence; (B) T1 relaxation function model (or curve) of MSM signal. In the experiment, the T1 value of this MSM solution was 2.8 s. According to the equations (M(t)=M_0 (1-2e^(-t/T_1 )) and signal zero-cross at t=ln2*T_1), the scale of the vertical axis (B) from -1 (or -M0, inversion) to 1 (or M0, recovery).
Reference/Book Chapter: Quantitative NMR in Qulality Control
in Quality Control of Chinese Medicines-Strategies and Methods